• info@confluence-trading.com
Confluence-Trading Confluence-Trading
  • Home
  • Services
    • Profit Curve
    • Seasonality
  • Blog
  • Subscription
    • Pricing
  • Company
    • Contact
  • Search
  • Login

2024-12-03 Corn runs into backwardation

Blog

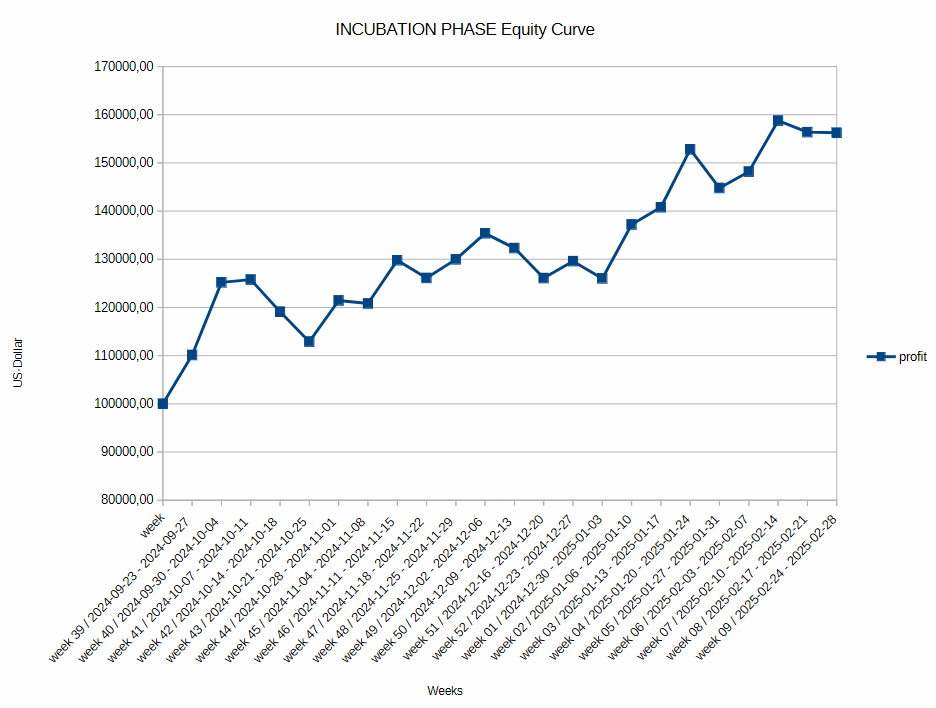
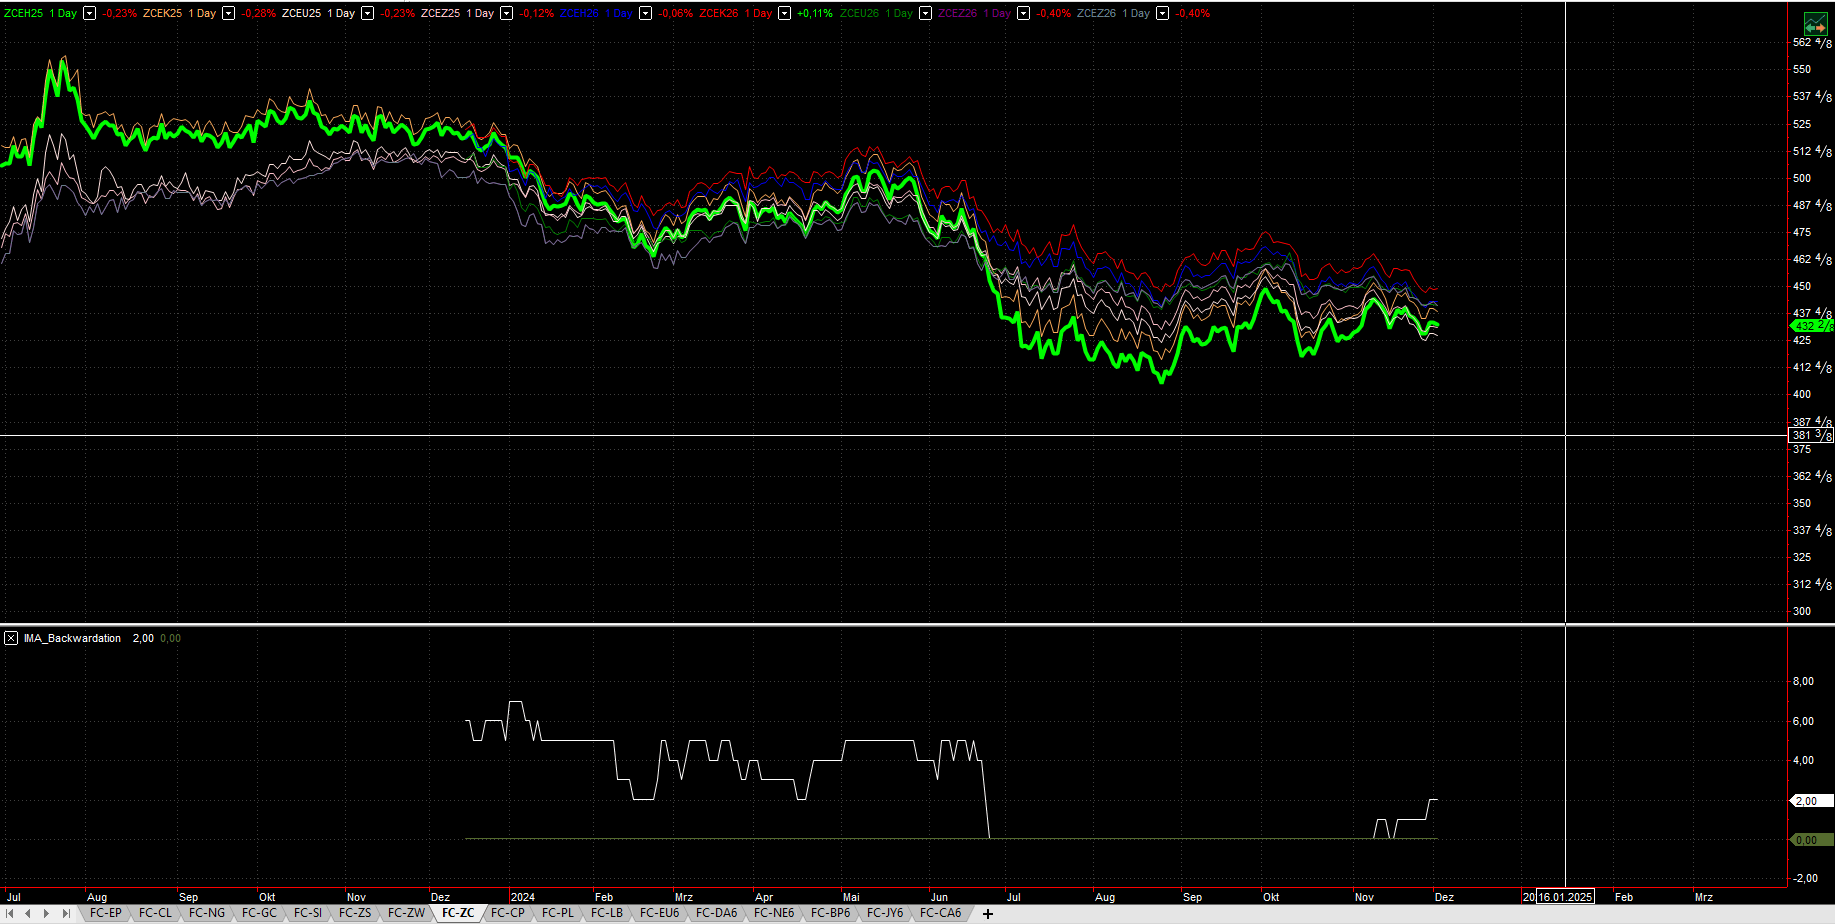
Watch out for CORN. Market runs into backwardation.

We expect higher prices!

2024-11-09 Bitcoin Volume Spikes

Blog

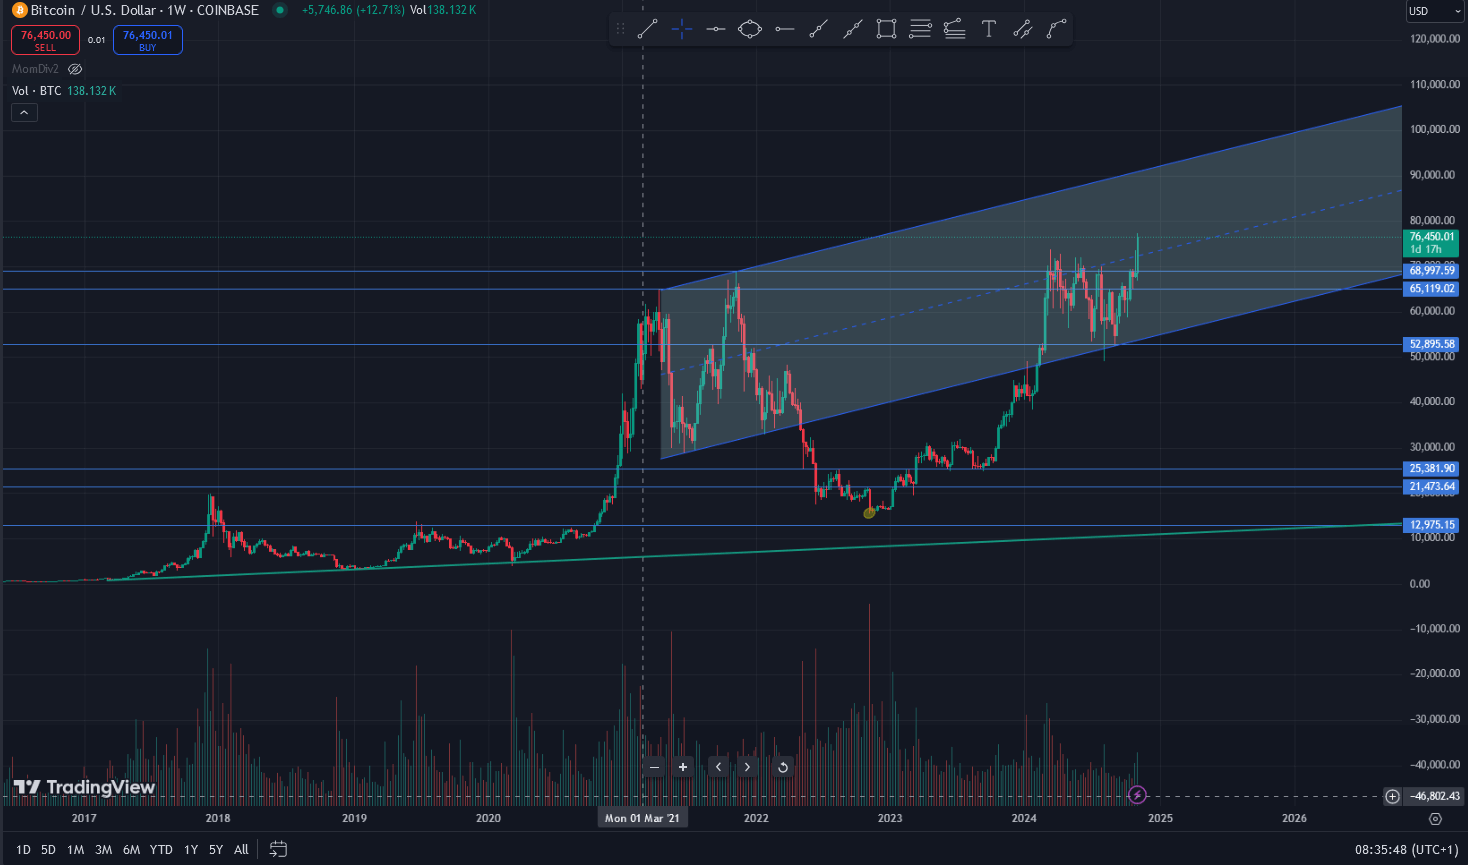
Volume spikes can signal potential trend reversals or the beginning of new trends, as large shifts in trading interest may mark shifts in market sentiment.

As we see clearly in the Bitcoin market. Here we can see the weekly chart:

2024-09-15 why is crude oil in backwardation for years now?

Blog

Crude oil has been in backwardation (where short-term futures are priced higher than long-term futures) for years, even during price declines. Here are some reasons why this happens:

  1. High Spot Market Demand: 
    • Backwardation suggests strong immediate demand for physical oil. Consumers and refineries may need oil quickly, which drives up short-term prices, even if long-term prices are lower due to expectations of stable supply.
  2. Storage Costs and Deterioration:
    • Storing crude oil is expensive due to the need for safe and secure facilities. In a backwardation market, it’s less profitable to store oil because future prices are lower than current ones. This incentivizes companies to sell or use oil immediately rather than keeping it in storage.
  3. Geopolitical and Supply Risks:
    • Geopolitical tensions, especially in key oil-producing regions like the Middle East, can cause short-term price spikes. These uncertainties elevate the current demand for oil, while future prices may remain lower due to expectations that the situation will eventually stabilize.
  4. OPEC Supply Management:
    • The OPEC group often manages oil supply by cutting production to support prices. By limiting output, they can create temporary supply shortages, which keep short-term prices high, even in a declining market.
  5. Refinery Operations and Seasonal Demand:
    • Refineries may adjust their operations seasonally, increasing demand for crude oil during specific periods (e.g., for winter heating oil). These fluctuations can drive up near-term prices, leading to backwardation, even when the overall market is declining.

In summary, backwardation persists in the crude oil market due to immediate demand, high storage costs, supply management by OPEC, and geopolitical factors, making short-term prices higher than long-term prices even during periods of falling prices.

2024-10-03 risk adjustment / ATR / position sizing / different futures markets

Blog

To trade the Soybean Futures Market and Crude Oil Futures with the same risk, considering the Average True Range (ATR) for setting stop losses and profit targets, you can use a method that balances the different volatility and contract sizes of the two markets. Here’s how to approach it:

Steps to Calculate:

  1. Determine the ATR:

    • The ATR gives you a measure of volatility. You can calculate the ATR for both Soybeans and Crude Oil over a chosen period (e.g., 14 days) or retrieve it from your charting software.
  2. Determine the contract size for Soybeans and Crude Oil:

    • Soybean Futures are traded on the CME (Chicago Mercantile Exchange) and represent 5,000 bushels per contract.
    • Crude Oil Futures (WTI) are traded on the NYMEX and represent 1,000 barrels per contract.
  3. Stop-Loss and Profit Target based on ATR:

    • Set your stop-loss and profit target in units of the ATR. A common approach is, for example, 1x ATR as a stop-loss and 2x ATR as a profit target (2:1 ratio).
  4. Risk Adjustment:

    • You want to keep the risk in both markets equal, meaning that you use the same $ risk per trade for both markets by adjusting the position size according to the ATR.
  5. Calculate the Position Size:

    • To determine the position size, use the formula:
      • {Position Size} = {Risk in $} / {ATR in $}
    • The ATR value needs to be converted into $ per contract as follows:
      • {ATR in $} = {ATR in points} * {value per point}
    • For Soybeans, the value per point is $50 (since one point = 0.01 and 5,000 bushels per contract).
    • For Crude Oil, the value per point is $1,000 (since one point = 1 and 1,000 barrels per contract).

Example:

  • ATR for Soybeans: 0.25 points
    • ATR (in $) = 0.25 points × $50 = $12.50 per contract
  • ATR for Crude Oil: 1.50 points
    • ATR (in $) = 1.50 points × $1,000 = $1,500 per contract

Risk per Trade (in $):

Let’s say you want to risk $500 per trade. The position sizes would be:

  • Position size for Soybeans:
    500 / 12.50 = 40 contracts
    Position size for Crude Oil:
    500 / 1500 = 0.33 contracts
  • Since you can’t trade fractional contracts, you’d either have to adjust your risk or reduce the position size for Soybeans.

Summary:

  • Calculate the ATR for each market.
  • Determine the ATR in $ per contract.
  • Set your risk per trade and calculate the corresponding position size, so you trade both markets with the same risk.


2024-08-17 Average Volatility (VIX) in S&P500

Blog

It's true that the month of August has historically been associated with higher volatility in the financial markets, and this is often reflected in the VIX (Volatility Index). The VIX, often referred to as the "fear gauge," measures market expectations of near-term volatility as implied by S&P 500 index options. Higher VIX values indicate increased market uncertainty and fear, which often leads to sharp market movements.

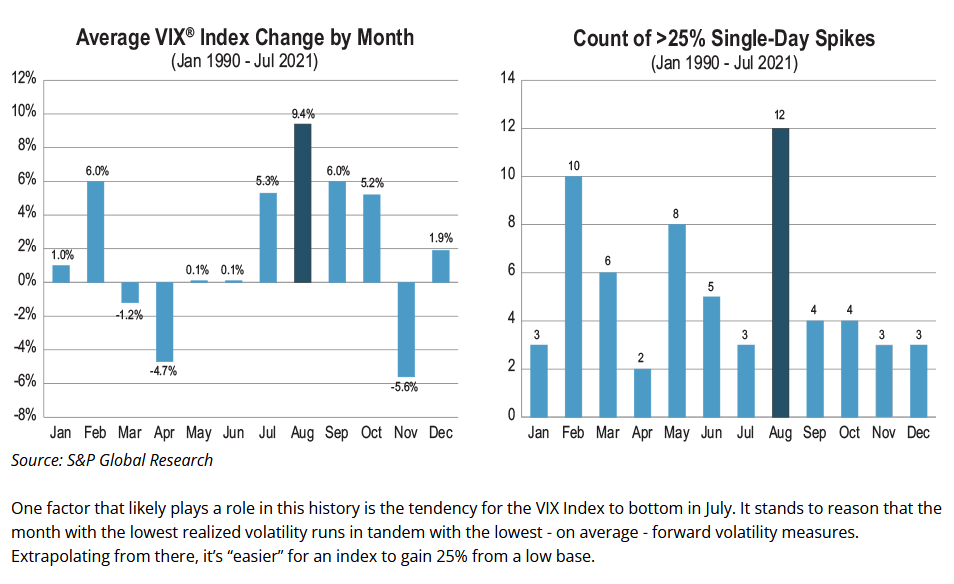
see: https://www.cboe.com/insights/posts/inside-volatility-trading-a-day-a-week-a-year-a-decade/

August's reputation for higher VIX peaks is grounded in historical patterns of market behavior, influenced by seasonal factors, liquidity issues, and significant economic or geopolitical events. While these factors make August a potentially volatile month, understanding these dynamics can help traders better navigate the markets during this period.


  1. 2024-08-18 Understanding COT Data and How to Use It in Trading

Seite 3 von 4

  • 1
  • 2
  • 3
  • 4

Smart-Search

Profit Curve

Latest Articles

  • 2025-11-19 Delayed COT Report Schedule 19. November 2025
  • 2025-09-15 High volume bubbles 15. September 2025
  • 2025-05-05 Natural Gas prices are climbing 05. Mai 2025
© 2024 Confluence-Trading
Sign In
  • Home
  • Services
    • Profit Curve
    • Seasonality
  • Blog
  • Subscription
    • Pricing
  • Company
    • Contact
  • Search
  • Login
  • info@confluence-trading.com