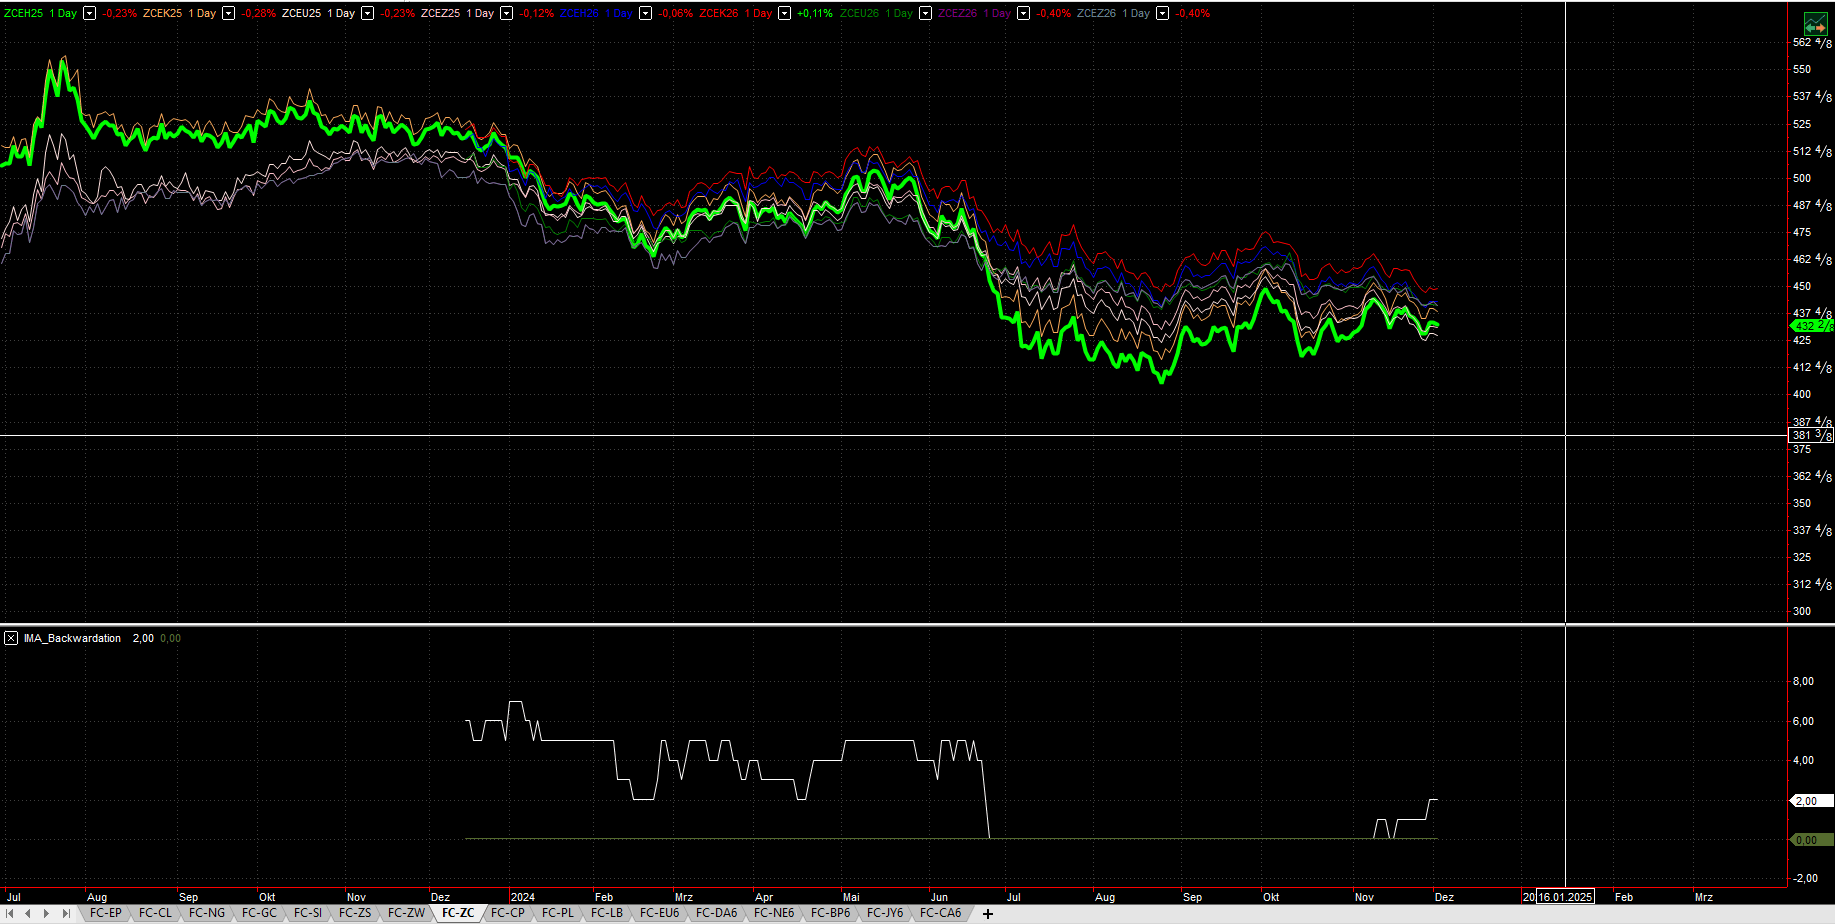
Watch out for CORN. Market runs into backwardation.
We expect higher prices!

Watch out for CORN. Market runs into backwardation.
We expect higher prices!

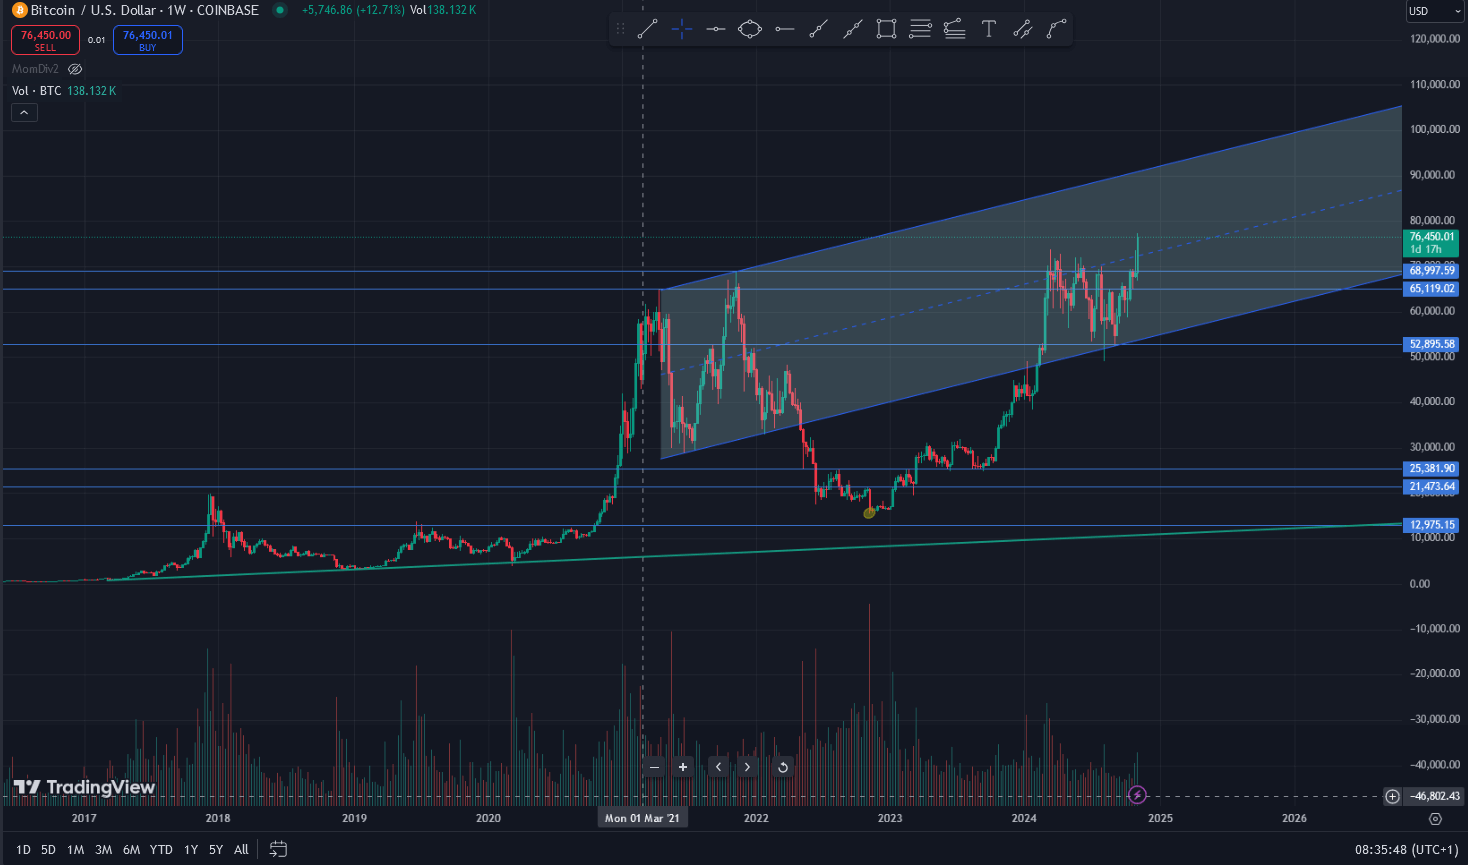
Volume spikes can signal potential trend reversals or the beginning of new trends, as large shifts in trading interest may mark shifts in market sentiment.
As we see clearly in the Bitcoin market. Here we can see the weekly chart:

Crude oil has been in backwardation (where short-term futures are priced higher than long-term futures) for years, even during price declines. Here are some reasons why this happens:
In summary, backwardation persists in the crude oil market due to immediate demand, high storage costs, supply management by OPEC, and geopolitical factors, making short-term prices higher than long-term prices even during periods of falling prices.
To trade the Soybean Futures Market and Crude Oil Futures with the same risk, considering the Average True Range (ATR) for setting stop losses and profit targets, you can use a method that balances the different volatility and contract sizes of the two markets. Here’s how to approach it:
Determine the ATR:
Determine the contract size for Soybeans and Crude Oil:
Stop-Loss and Profit Target based on ATR:
Risk Adjustment:
Calculate the Position Size:
Let’s say you want to risk $500 per trade. The position sizes would be:
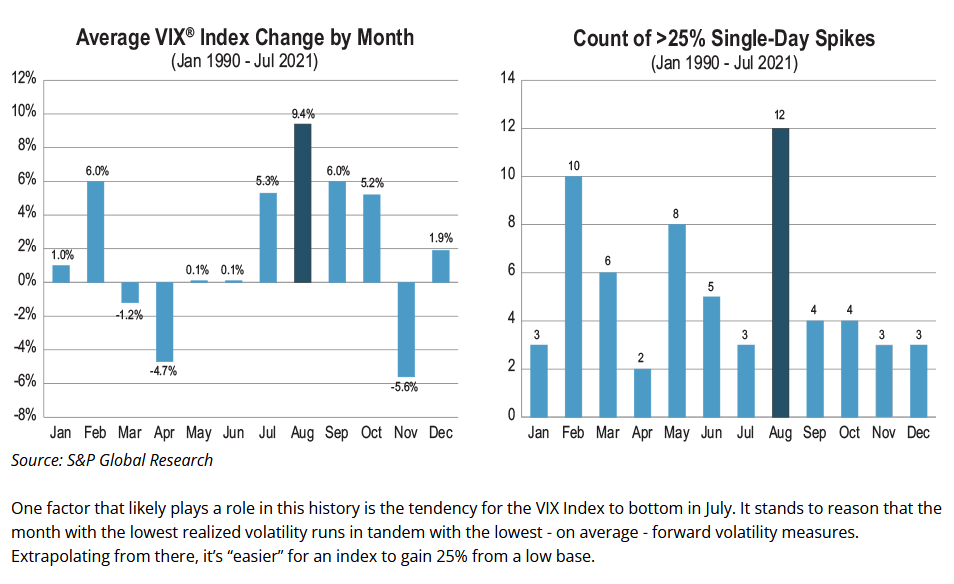
It's true that the month of August has historically been associated with higher volatility in the financial markets, and this is often reflected in the VIX (Volatility Index). The VIX, often referred to as the "fear gauge," measures market expectations of near-term volatility as implied by S&P 500 index options. Higher VIX values indicate increased market uncertainty and fear, which often leads to sharp market movements.

see: https://www.cboe.com/insights/posts/inside-volatility-trading-a-day-a-week-a-year-a-decade/
August's reputation for higher VIX peaks is grounded in historical patterns of market behavior, influenced by seasonal factors, liquidity issues, and significant economic or geopolitical events. While these factors make August a potentially volatile month, understanding these dynamics can help traders better navigate the markets during this period.