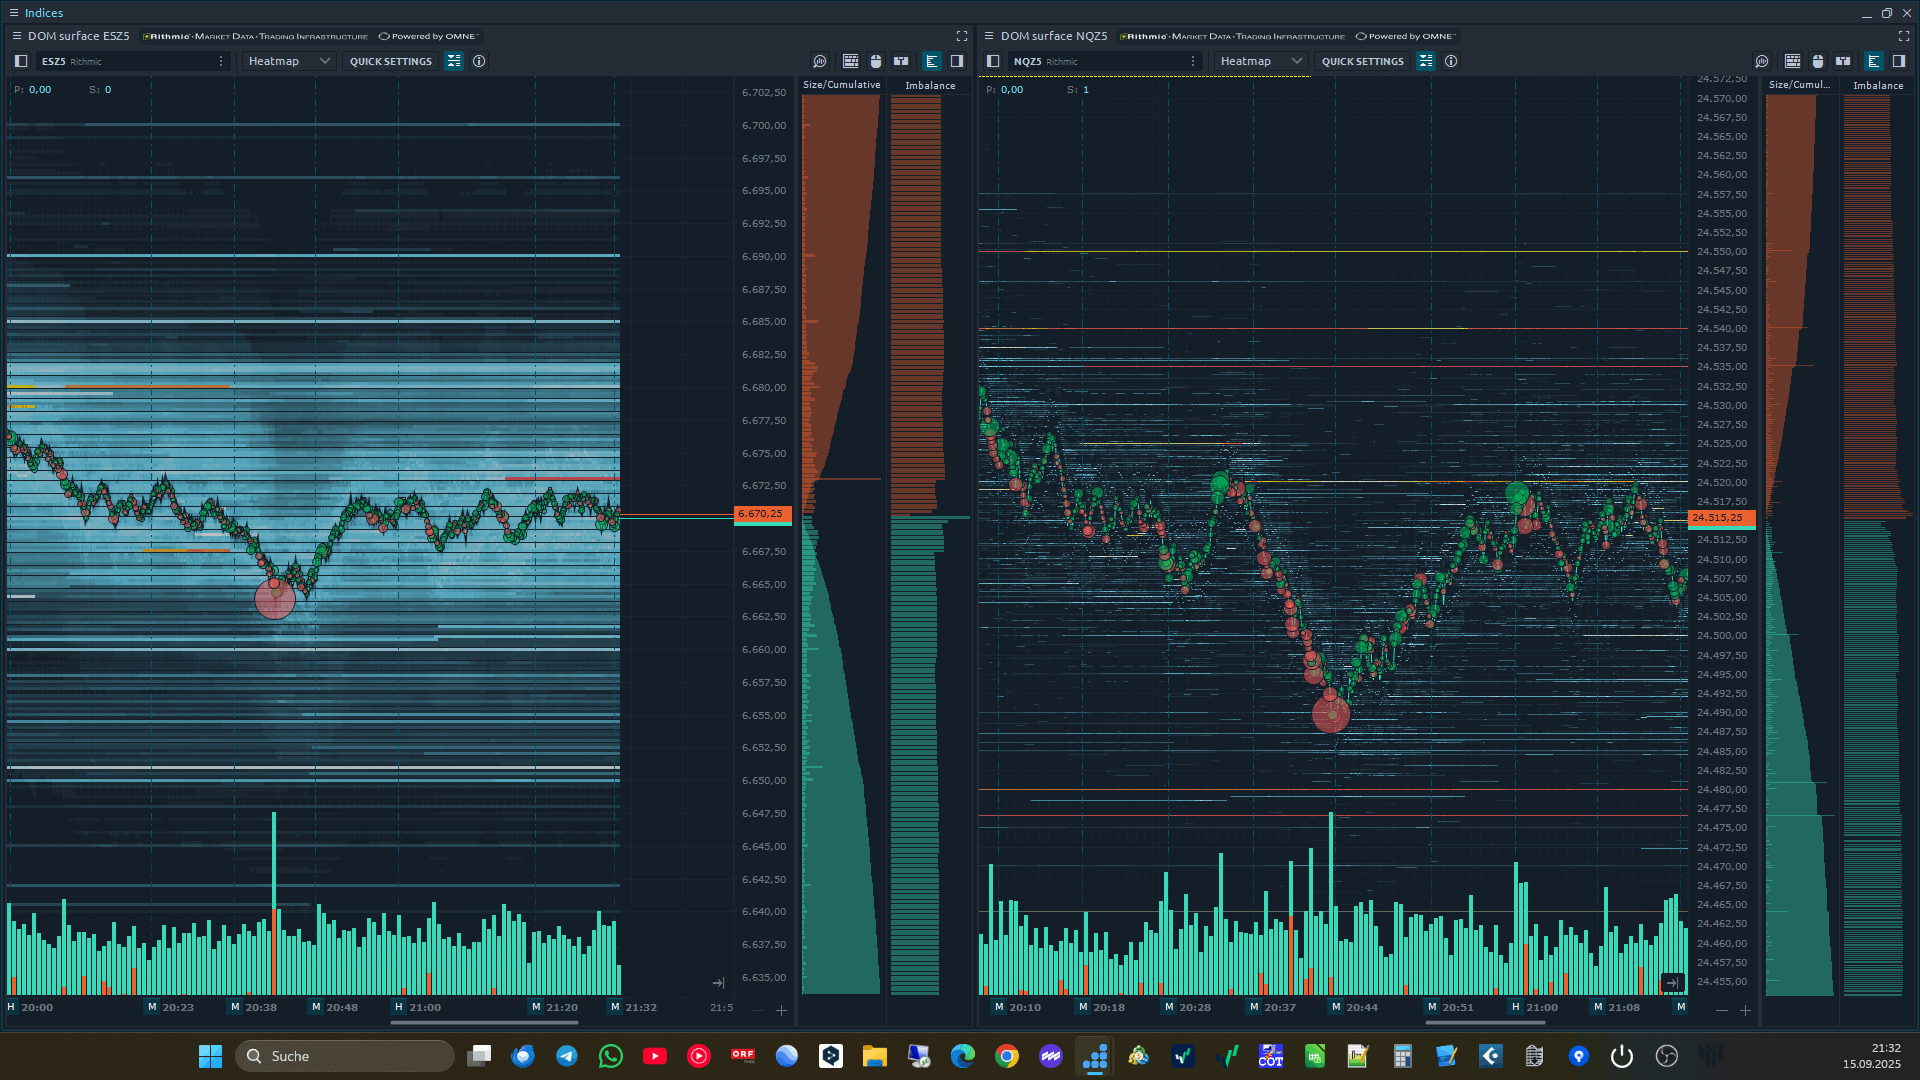
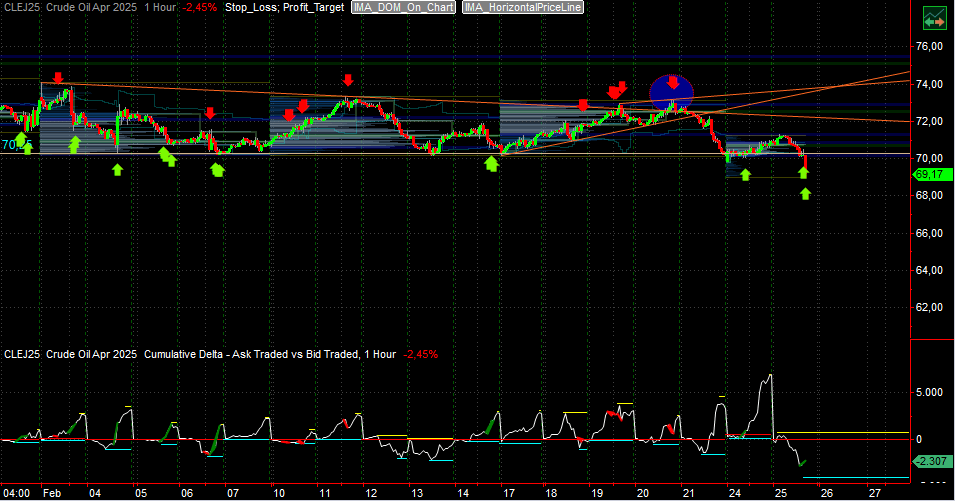
Look, how these green bubbles can indicate an intraday top.
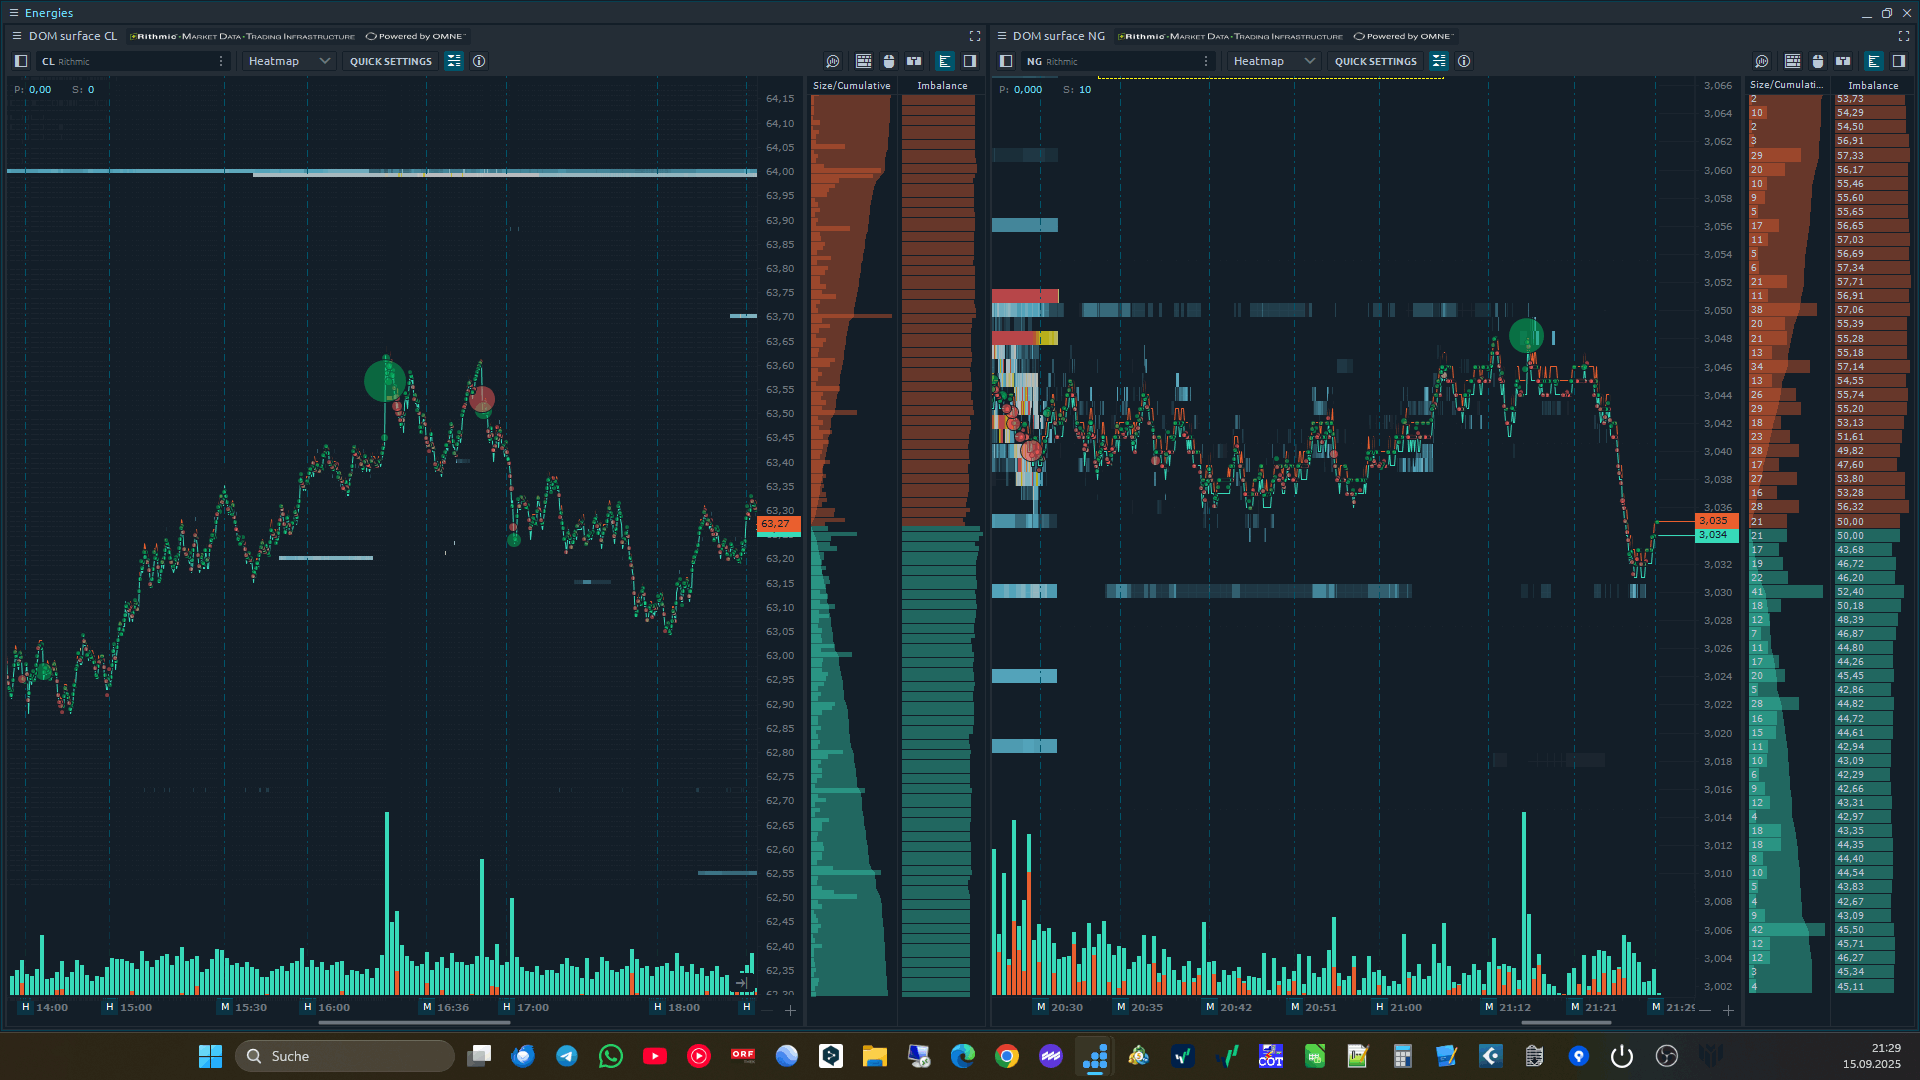
Or red bubbles a intraday bottom
Why does the platinum future performs not as good as the gold future? It seems, it has lost its correlation.
The platinum future has often underperformed compared to gold due to several factors:
1. Industrial Demand vs. Safe-Haven Asset
-
Gold is a safe-haven asset, rising in uncertain times.
-
Platinum depends on industrial demand (e.g., automotive, jewelry), which drops in weak economies.
2. Substitution by Palladium
-
Used in catalytic converters, but increasingly replaced by palladium (cheaper, more efficient).
-
This reduces platinum’s industrial demand.
3. Supply & Production
-
Mined mainly in South Africa & Russia; supply issues can affect prices.
-
Gold has a broader mining network and steady central bank demand.
4. Speculative Demand & ETFs
-
Gold attracts central banks & ETFs; platinum has lower investor interest.
Conclusion:
Gold thrives in uncertainty and crisis, while platinum relies on industrial use and faces substitution.
Last week, natural gas futures surged by approximately 16.6%, closing at $3.670 per MMBtu. This increase was driven by several key factors:
Main Reasons for the Price Increase
-
Positive Summer Weather Forecasts
Expectations of a hot summer suggest higher demand for natural gas to power air conditioning, which pushed prices higher. -
Strong U.S. Jobs Report
A robust U.S. labor market signaled ongoing economic strength, which supported energy prices. -
Decline in U.S. Natural Gas Production
U.S. daily gas output dropped to a four-week low of 100.1 billion cubic feet per day, tightening supply. -
Increased LNG Exports
New LNG export facilities like Plaquemines LNG and Corpus Christi Stage 3 have come online, increasing U.S. gas export capacity and demand. -
Cooler Weather Forecasts
Forecasts for colder weather raised expectations of higher heating demand, adding further upward pressure on prices.
This combination of rising demand and tightening supply led to the significant price rally in natural gas futures over the past week.
Smart-Search
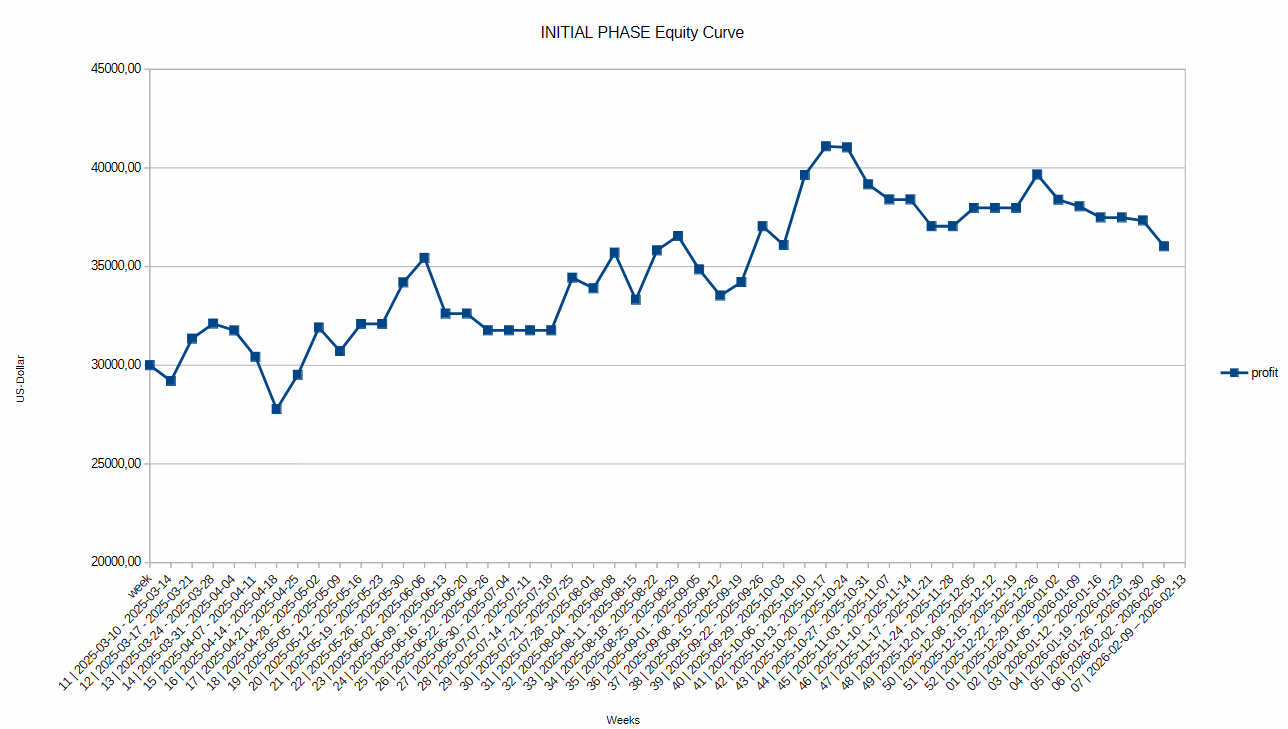
Profit Curve